Statistics, Data Analysis and Probability for Grade 12, Problem ID: 5431
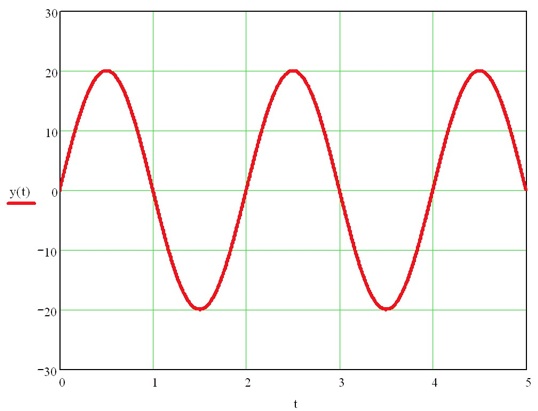 Leslie Green asks: " The sinusoidal waveform shown has a peak amplitude of 20 and a period of 2. What is a rough estimate for the mean value of the waveform over the interval shown (from t=0 to t=5)? (There is no need to use Calculus).
HINT: Areas below the x-axis should be considered as negative when calculating the mean. "
40.220.4