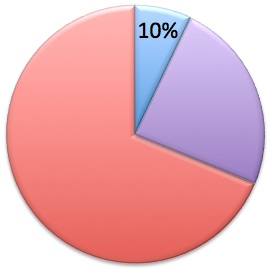
 The pie chart represents the results of an election.
The least lucky candidate received 10%, while the most lucky candidate won the election, receiving three times as many votes as the second-placed candidate.
What percentage of votes did the winner receive?